Last updated: April 22, 2026
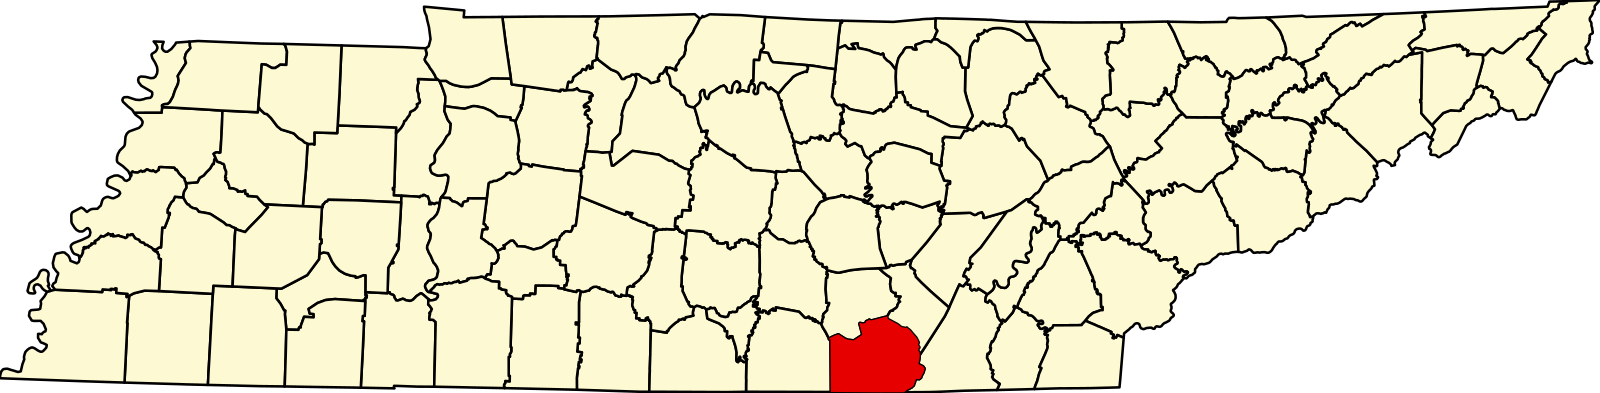
Marion County is a largely rural county in southeast Tennessee, part of the Chattanooga, TN-GA Metropolitan Statistical Area. Its economy, land use, and government reflect the same plateau-and-valley geography that shaped its settlement: smallholder agriculture in the Sequatchie Valley and on the river bottoms, concentrated manufacturing and retail along the I-24 corridor, and an elected county government seated at Jasper since 1819. The county covers 512 square miles (498 land, 14 water) and is classified as Transitional by the Appalachian Regional Commission for fiscal year 2026, with two census tracts rated Distressed.
County Snapshot
Population History, 1820 to 2020
Marion County was established in 1817 and first enumerated in the 1820 census with a population of 3,888. Growth was slow through the antebellum period, limited by the county's rugged plateau-and-valley terrain. The most dramatic growth came during the industrial boom of 1870 to 1910, when coal mining, coke production, iron smelting, and the founding of South Pittsburg by British capital nearly tripled the population from 6,841 to 18,820 in four decades. The county lost population in the 1910s as mines closed and coal seams depleted, then stagnated through the 1920s. TVA construction beginning in the 1930s, rural electrification, and wartime industry drove a steady recovery from the late Depression years through the 1950s. A second dip in the 1960s reflected outmigration to urban jobs, but the completion of Interstate 24 in the mid-1970s produced the largest single-decade gain since the 1890s: an 18.7 percent jump from 1970 to 1980. Since then, growth has continued at a modest 1 to 2 percent per decade, reaching 28,837 in 2020. The Census Bureau's American Community Survey 5-year average for 2020 to 2024 centers on roughly 29,250 residents, consistent with slow continued growth.
Marion County Population, 1820 to 2020
Source: U.S. Census Bureau, decennial censuses 1820 to 2020. Historical totals compiled at Wikipedia: Marion County, Tennessee from census publications.
| Census year | Population | Change | % change | Context |
|---|---|---|---|---|
| 1820 | 3,888 | First census after county formation (1817) | ||
| 1830 | 5,508 | +1,620 | +41.7% | Frontier settlement period |
| 1840 | 6,070 | +562 | +10.2% | |
| 1850 | 6,314 | +244 | +4.0% | |
| 1860 | 6,190 | −124 | −2.0% | Pre-war stagnation |
| 1870 | 6,841 | +651 | +10.5% | Post-war recovery begins |
| 1880 | 10,910 | +4,069 | +59.5% | Coal, iron, and coke boom; South Pittsburg founded |
| 1890 | 15,411 | +4,501 | +41.3% | Peak industrial expansion |
| 1900 | 17,281 | +1,870 | +12.1% | |
| 1910 | 18,820 | +1,539 | +8.9% | Pre-war industrial peak |
| 1920 | 17,402 | −1,418 | −7.5% | Mine closures, coal depletion |
| 1930 | 17,549 | +147 | +0.8% | Depression-era stagnation |
| 1940 | 19,140 | +1,591 | +9.1% | TVA construction, rural electrification |
| 1950 | 20,520 | +1,380 | +7.2% | Postwar growth |
| 1960 | 21,036 | +516 | +2.5% | |
| 1970 | 20,577 | −459 | −2.2% | Outmigration to urban jobs |
| 1980 | 24,416 | +3,839 | +18.7% | I-24 completed; largest gain since 1890s |
| 1990 | 24,860 | +444 | +1.8% | |
| 2000 | 27,776 | +2,916 | +11.7% | Exurban growth from Chattanooga |
| 2010 | 28,237 | +461 | +1.7% | |
| 2020 | 28,837 | +600 | +2.1% |
Population by Community
The county's population concentrates along the I-24 corridor and in the Sequatchie Valley floor. Jasper, the county seat, has grown steadily since the interstate era and is now the largest municipality. South Pittsburg peaked in 1960 (reflecting the annexation of Richard City) and has since declined. Kimball, built around the I-24/US-72 interchange, has been the fastest-growing community in percentage terms since 1970.
| Community | 1890 | 1920 | 1960 | 1980 | 2000 | 2010 | 2020 |
|---|---|---|---|---|---|---|---|
| Jasper | 902 | 728 | 1,450 | 2,633 | 3,214 | 3,279 | 3,612 |
| South Pittsburg | 1,479 | 2,356 | 4,130 | 3,636 | 3,295 | 2,992 | 3,106 |
| Whitwell | 906 | 1,857 | 1,783 | 1,660 | 1,699 | 1,641 | |
| Monteagle | 1,126 | 1,238 | 1,192 | 1,393 | |||
| Kimball | 1,220 | 1,312 | 1,395 | 1,545 |
Source: U.S. Census Bureau, decennial census reports, compiled at Wikipedia: Marion County, Tennessee and individual community articles. Blank cells indicate the community was not separately enumerated in that census. Monteagle's total spans Marion, Grundy, and Franklin counties.
Racial and Ethnic Composition
Marion County has been predominantly white throughout its history, reflecting its mountain geography and smallholder economy. Slaveholding existed before the Civil War but at much lower rates than in Middle or West Tennessee. In East Tennessee as a whole, approximately one person in twelve was enslaved in 1860, compared to one in three across Middle Tennessee. Marion County's rugged terrain and lack of large-scale plantation agriculture kept the enslaved population proportionally small.
A Black community grew during the industrial boom of the 1870s through the 1910s, as workers migrated to the county's coal mines, coke ovens, and the Dixie Portland Cement plant at Richard City. A 1908 account in the Manufacturer's Record, reprinted in the South Pittsburg Hustler, described company-built housing for Black laborers behind the cement plant. The 1910 census recorded that almost half of workers listed as heads of households or single men in Richard City were Black. South Pittsburg became the center of Black community life. McReynolds High School, the segregated Black high school in South Pittsburg, first opened in rented quarters in 1918 and moved into a permanent Rosenwald-funded building in 1921. It served Black students from Marion County and northern Jackson County, Alabama until the building burned in the summer of 1965; with desegregation already underway, the school was not rebuilt, and the class of 1966 was its last. The Civil Rights Era page covers the desegregation process in detail. The last Black family left Richard City by the 1970s.
2020 Census Racial Composition
Marion County Racial and Ethnic Makeup, 2020
Source: U.S. Census Bureau, 2020 Decennial Census (Redistricting Data, Table P2). Statewide totals from the Tennessee summary via the Marion County, Tennessee Wikipedia summary of the 2020 P2 file.
Change from 2010 to 2020
Between 2010 and 2020, the white non-Hispanic share declined from 93.9 to 89.1 percent, while the Hispanic or Latino population grew from 1.3 to 2.1 percent and the multiracial category grew from 1.2 to 4.4 percent. The Black population remained essentially stable at 3.6 percent. These shifts mirror broader national and state patterns of growing diversity, though Marion County remains substantially less diverse than Tennessee as a whole (73.5 percent white non-Hispanic statewide in 2020).
| Group | 2010 | 2020 | Tennessee 2020 |
|---|---|---|---|
| White (non-Hispanic) | 93.9% | 89.1% | 73.5% |
| Black | 3.6% | 3.6% | 16.7% |
| Hispanic / Latino | 1.3% | 2.1% | 6.7% |
| Asian | 0.2% | 0.5% | 2.1% |
| Native American | 0.4% | 0.3% | 0.4% |
| Two or more / Other | 1.2% | 4.4% | 3.7% |
Source: U.S. Census Bureau, 2010 and 2020 Decennial Census, via the Tennessee summary page on Wikipedia (Table P2).
South Pittsburg has the county's largest Black population both in absolute terms and as a share of its residents: approximately 18.5 percent in 2020 (574 of 3,106), compared to 3.6 percent countywide. This concentration reflects the city's historical role as the center of Black community life in the county. The Black History of Marion County page traces the full arc of that community from the antebellum era through the present.
Age Distribution
Marion County skews older than Tennessee. Its median age of 43.8 years is nearly five years above the state median of 38.9. Just over one in five residents (20.9 percent) is 65 or older, compared to 17.1 percent statewide, while the share under 18 (20.3 percent) trails the state average (22.2 percent). This age structure reflects limited local job opportunities for younger adults, the county's appeal as a lower-cost retirement destination, and outmigration of working-age residents to urban labor markets.
Age Profile: Marion County vs. Tennessee
Source: U.S. Census Bureau, American Community Survey 5-year estimates, 2020 to 2024 (Table DP05). Retrieved via api.census.gov.
- Median age: 43.8 years (Tennessee: 38.9)
- Under 18: 20.3% (Tennessee: 22.2%)
- 65 and older: 20.9% (Tennessee: 17.1%)
- Sex distribution: 49.9% male, 50.1% female
- Total households: 11,869
- Average household size: 2.45 persons
Households, Families, and Language
Of the county's 11,869 households, 51.7 percent are married-couple households (Tennessee: 46.8 percent), reflecting a more traditional family structure than the state as a whole. The county has an unusually high share of households receiving Social Security income (41.9 percent, vs. 32.5 percent statewide), consistent with its older age profile, and 27.1 percent of households receive retirement income.
English is spoken at home in 98.3 percent of Marion County households for the population five years and older, compared to 91.4 percent statewide. Only 1.7 percent of residents speak a language other than English at home, with the remaining shares split primarily between Spanish (1.3 percent) and other Indo-European languages (0.2 percent). The foreign-born population totals 347 people, or 1.2 percent of the county, compared to 6.1 percent statewide.
| Measure | Marion County | Tennessee |
|---|---|---|
| Total households | 11,869 | 2,824,277 |
| Average household size | 2.45 | 2.45 |
| Married-couple households | 51.7% | 46.8% |
| Households with Social Security | 41.9% | 32.5% |
| Households with retirement income | 27.1% | 23.6% |
| Households with a computer | 90.7% | 94.5% |
| Households with broadband Internet | 85.3% | 89.2% |
| English only at home (age 5+) | 98.3% | 91.4% |
| Foreign-born population | 1.2% | 6.1% |
Source: U.S. Census Bureau, American Community Survey 5-year estimates, 2020 to 2024, Table DP02.
Economy and Employment
Marion County's economy has moved through three broad phases: extractive industries (coal, coke, iron) in the late 19th and early 20th centuries; hydroelectric and diversified manufacturing expansion in the TVA era; and, more recently, a mix of light manufacturing, health care, retail, construction, and tourism tied to the I-24 corridor and the Tennessee River Gorge. The Bureau of Labor Statistics Local Area Unemployment Statistics report a civilian labor force of 12,433 workers and employment of 11,933 for the 2024 annual average, producing an unemployment rate of 4.0 percent, matching the rate for 2022 and 2023. The 2020 rate spiked to 7.8 percent with the pandemic contraction before recovering. Labor force participation is lower than the state average: the American Community Survey puts participation for Marion County residents 16 and over at 54.1 percent, against 62.4 percent statewide.
Unemployment trend, 2019 to 2024
| Year | Labor force | Employment | Unemployment rate |
|---|---|---|---|
| 2019 | 12,122 | 11,589 | 4.3% |
| 2020 | 11,826 | 10,852 | 7.8% |
| 2021 | 11,761 | 11,207 | 4.8% |
| 2022 | 11,885 | 11,407 | 4.0% |
| 2023 | 12,198 | 11,749 | 4.0% |
| 2024 | 12,433 | 11,933 | 4.0% |
Source: U.S. Bureau of Labor Statistics, Local Area Unemployment Statistics, Marion County, Tennessee, annual averages not seasonally adjusted (series LAUCN471150000000003, LAUCN471150000000005, LAUCN471150000000006).
Employment by industry
Manufacturing is Marion County's single largest industry of employment, representing 18.7 percent of the county's civilian employed population, well above the state rate of 12.5 percent. The combined educational services and health care and social assistance category employs a slightly larger share at 18.8 percent, though below the 22.4 percent Tennessee average. Construction (10.1 percent) and retail trade (9.8 percent) round out the top four. Information and professional services are underrepresented relative to the state, consistent with the county's rural character and distance from urban job clusters.
Employment by Industry, Marion County Residents
Source: U.S. Census Bureau, American Community Survey 5-year estimates, 2020 to 2024, Table DP03. Information industry (0.3 percent) omitted for space.
Occupations and class of worker
Marion County's occupational mix is shifted toward blue-collar and service roles relative to the state. Production, transportation, and material moving occupations account for 20.0 percent of employment (Tennessee: 16.4 percent), and natural resources, construction, and maintenance occupations account for 13.3 percent (Tennessee: 8.7 percent). Management, business, science, and arts occupations account for 31.7 percent of jobs, well below the 39.3 percent state rate. Service occupations account for 18.5 percent and sales and office for 16.5 percent. Just over three-quarters of workers (78.2 percent) are private wage and salary employees, 13.6 percent work for government at any level, and 8.2 percent are self-employed in their own unincorporated business.
Major employers
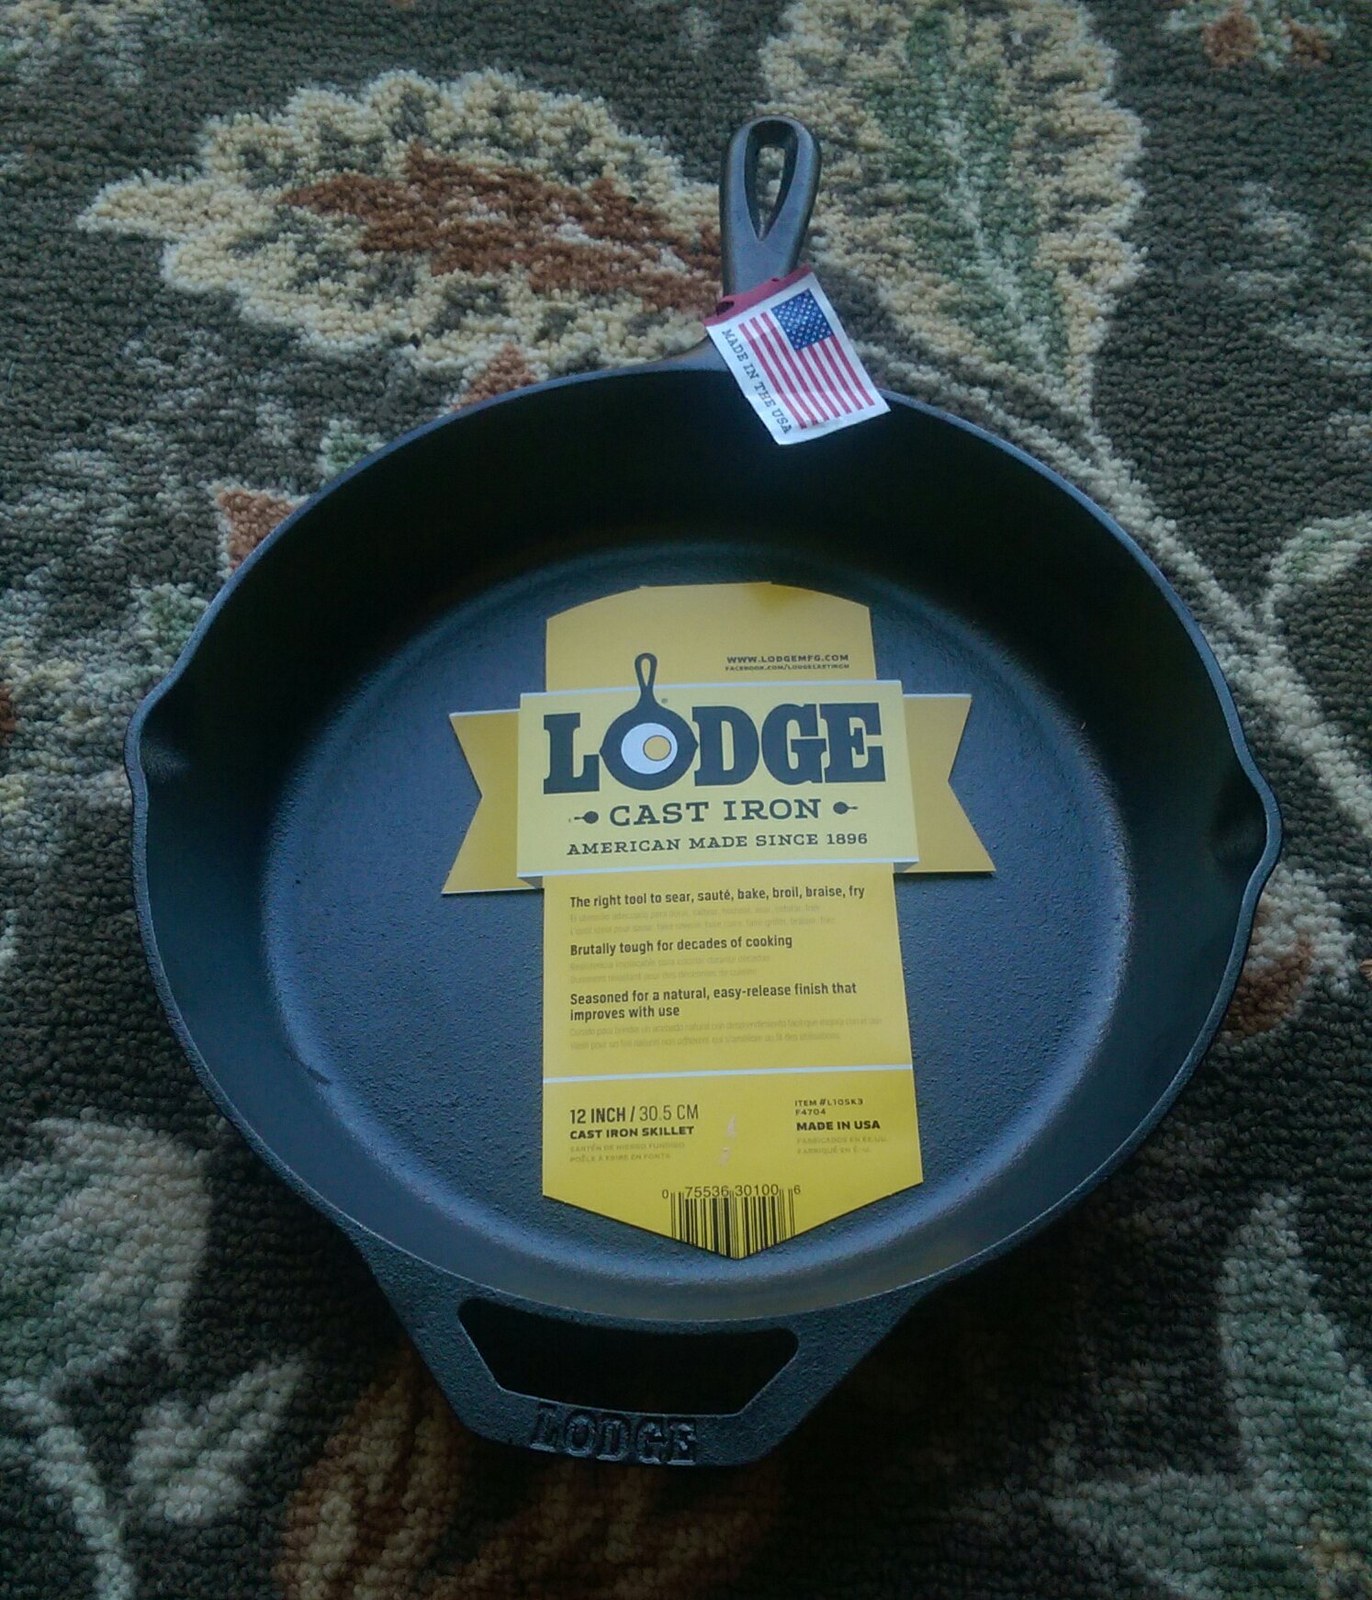
Lodge Manufacturing Company (Lodge Cast Iron) in South Pittsburg is the county's largest private employer. The family-owned cast-iron cookware maker has operated since 1896 and announced a $56 million expansion in October 2021, adding 239 jobs. Other significant employers include Marion County Schools, Erlanger Western Carolina Hospital and associated clinics, Cardin Forest Products (a modern sawmill), Colonial Chemical, Shaw Floors, Ply Gem, Tennessee Galvanizing, US Stove, and Vulcan Materials, which operates the former Dixie Portland Cement quarry site at Richard City. The historic Penn-Dixie/Dixie Portland Cement plant at Richard City employed more than 650 people at its peak around 1917 but closed in 1982.
Income, Poverty, and Public Assistance
Marion County's median household income was $61,824 in the American Community Survey 5-year estimates for 2020 to 2024 (2024 inflation-adjusted dollars), about 89 percent of Tennessee's statewide median of $69,595. Median family income was $74,534, against $87,314 statewide. Per capita income was $32,016, compared to $39,437 in Tennessee. The overall poverty rate was 16.3 percent, two and a half percentage points above the Tennessee rate of 13.8 percent. Poverty is most concentrated among children under 18 (20.8 percent) and among people living in families with a female householder and no spouse present (44.4 percent).
Median Household Income Comparison
Source: U.S. Census Bureau, American Community Survey 5-year estimates, 2020 to 2024, Table DP03 (2024 inflation-adjusted dollars).
Poverty by group
| Group below poverty | Marion County | Tennessee |
|---|---|---|
| All people | 16.3% | 13.8% |
| Under 18 years | 20.8% | 18.8% |
| 18 to 64 years | 16.2% | 12.7% |
| 65 years and over | 12.4% | 11.0% |
| All families | 13.1% | 9.8% |
| Female-householder families | 44.4% | 26.6% |
| Unrelated individuals 15+ | 31.5% | 25.1% |
Source: U.S. Census Bureau, American Community Survey 5-year estimates, 2020 to 2024, Table DP03.
Social Security, retirement, and public assistance
Marion County relies more heavily than the state on income from public programs and insurance, consistent with its older age profile and lower wage base. About 41.9 percent of households receive Social Security income, 7.4 percent receive Supplemental Security Income, 14.6 percent received SNAP benefits in the past 12 months, and 27.1 percent receive retirement income. Earnings from work reach only 68.0 percent of households, below the state rate of 76.4 percent.
- Median household income: $61,824 (Tennessee: $69,595)
- Median family income: $74,534 (Tennessee: $87,314)
- Per capita income: $32,016 (Tennessee: $39,437)
- Median earnings for workers: $37,313 (Tennessee: $42,418)
- Overall poverty rate: 16.3% (Tennessee: 13.8%)
- Households receiving SNAP: 14.6% (Tennessee: 10.8%)
Housing
The county had 14,058 housing units in the 2020 to 2024 American Community Survey, of which 11,869 (84.4 percent) were occupied. Homeownership is high: 78.5 percent of occupied units are owner-occupied, well above the Tennessee rate of 66.9 percent. Mobile homes are a substantial share of the housing stock at 19.1 percent, more than twice the statewide rate of 8.1 percent. The median owner-occupied home value was $195,200, compared to $286,700 statewide.
Monthly housing costs
Median monthly owner costs for housing units with a mortgage were $1,299 in Marion County, against $1,566 statewide. For owners without a mortgage, median monthly costs were $379 (Tennessee: $464). The median gross rent was $853, roughly $336 below the state median of $1,189. Rent pressure is nonetheless significant: 36.2 percent of renter households spent 35 percent or more of their income on gross rent, slightly below the statewide rate of 39.7 percent but still a substantial cost burden. Within the rental stock, 16.3 percent of rent-paying units rent for less than $500 per month, typical of an older housing stock with limited new construction.
Median Owner-Occupied Home Value
Source: U.S. Census Bureau, American Community Survey 5-year estimates, 2020 to 2024, Table DP04.
- Total housing units: 14,058
- Occupied units: 11,869
- Homeownership rate: 78.5% (Tennessee: 66.9%)
- Renter-occupied: 21.5%
- Mobile homes (share of units): 19.1% (Tennessee: 8.1%)
- Median home value: $195,200 (Tennessee: $286,700)
- Median monthly cost, with mortgage: $1,299
- Median monthly cost, no mortgage: $379
- Median gross rent: $853
- Occupied units with no vehicle: 4.2%
Education
Educational attainment in Marion County tracks lower than state and national averages, particularly at the postsecondary level. Among adults 25 and older, 83.2 percent have at least a high school diploma or equivalent (Tennessee: 90.0 percent). Bachelor's-degree attainment is where the gap widens most: 17.1 percent of Marion County adults hold a bachelor's degree or higher, well below Tennessee's 31.1 percent and the national rate of about 36 percent. The gap reflects the county's manufacturing and trades-oriented labor market, limited local postsecondary options, and outmigration of college graduates to urban labor markets. The county is served by the Marion County Schools system and the independent Richard City Special School District.
Educational Attainment: Marion County vs. Tennessee (Age 25+)
High school diploma or higher
Bachelor's degree or higher
Source: U.S. Census Bureau, American Community Survey 5-year estimates, 2020 to 2024, Table DP02.
Attainment breakdown
| Highest attainment (age 25+) | Marion County | Tennessee |
|---|---|---|
| Less than 9th grade | 6.0% | 3.7% |
| 9th to 12th grade, no diploma | 10.8% | 6.3% |
| High school graduate (incl. equivalency) | 37.5% | 31.2% |
| Some college, no degree | 20.5% | 19.9% |
| Associate's degree | 8.1% | 7.9% |
| Bachelor's degree | 11.1% | 19.4% |
| Graduate or professional degree | 6.1% | 11.7% |
Source: U.S. Census Bureau, American Community Survey 5-year estimates, 2020 to 2024, Table DP02.
Health, Insurance, and Disability
Marion County sits in the broader Appalachian health-disparity region. The County Health Rankings program ranked Marion County 56th out of 95 Tennessee counties for health outcomes and 53rd for health factors in its 2022 assessment, placing it slightly below the state median on both measures. Tennessee as a whole ranks among the less healthy states nationally, so a mid-tier Tennessee ranking still indicates significant health challenges by national standards. A historical data point available at the county level is the infant-mortality rate, which rose from 5.8 per 1,000 live births in the 1990 to 1999 period to 8.7 per 1,000 in the 2000 to 2006 period.
Health insurance coverage
Despite the county's income challenges, insurance coverage in Marion County is slightly better than the state average. About 91.7 percent of civilian non-institutionalized residents had health insurance, compared to 90.0 percent statewide. The county relies more heavily on public coverage (44.0 percent, against 36.2 percent statewide), a pattern consistent with its older population and higher Medicare and Medicaid eligibility, and somewhat less on private insurance (61.8 percent, vs. 66.4 percent statewide). Children are well covered, with only 3.5 percent of residents under 19 uninsured against 5.9 percent statewide.
Disability
Disability rates are notably higher than in Tennessee overall. About 19.1 percent of Marion County's civilian non-institutionalized population lives with one or more disabilities, compared to 14.9 percent statewide. The gap is largest in the working-age bracket: 17.4 percent of residents aged 18 to 64 have a disability (Tennessee: 12.6 percent). Among residents 65 and over, 37.7 percent report a disability, close to the state rate of 36.2 percent.
- With health insurance: 91.7% (Tennessee: 90.0%)
- With private coverage: 61.8% (Tennessee: 66.4%)
- With public coverage: 44.0% (Tennessee: 36.2%)
- Uninsured: 8.3% (Tennessee: 10.0%)
- Uninsured children under 19: 3.5% (Tennessee: 5.9%)
- Any disability (all ages): 19.1% (Tennessee: 14.9%)
- Disability, 18 to 64: 17.4% (Tennessee: 12.6%)
- Health outcomes rank: 56th of 95 TN counties (2022)
Source: U.S. Census Bureau, American Community Survey 5-year estimates, 2020 to 2024, Tables DP02 and DP03; County Health Rankings & Roadmaps: Tennessee.
Veterans
Marion County has a larger share of veterans than Tennessee overall. Of the 23,319 civilian residents aged 18 and over, 2,121 are veterans, or 9.1 percent, compared to 7.3 percent statewide. The county's modern veteran population reflects service from the post-Vietnam era forward, with a concentration of Gulf War-era and earlier veterans consistent with the county's older age profile.
Commuting and Migration
Marion County's membership in the Chattanooga Metropolitan Statistical Area reflects substantial economic integration with the Chattanooga labor market in Hamilton County, roughly 35 to 40 miles to the southeast via I-24. The mean commute time for Marion County workers is 33.9 minutes, 8.2 minutes longer than the Tennessee average of 25.7 minutes, a strong indicator that many residents commute out of the county for work.
Roughly three-quarters of workers (74.5 percent) drive alone, 9.1 percent carpool, and 13.1 percent work from home, modestly above the 12.9 percent statewide work-from-home rate. Public transit use is essentially nil (0.9 percent), reflecting the lack of a local transit system. Vehicles available per occupied unit are typical of rural counties, with only 4.2 percent of households lacking any vehicle.
- Mean commute time: 33.9 minutes (Tennessee: 25.7)
- Drove alone: 74.5%
- Worked from home: 13.1%
- Carpooled: 9.1%
- Public transit: 0.9%
- Walked or other: 2.5%
- No vehicle available: 4.2% of households
Source: U.S. Census Bureau, American Community Survey 5-year estimates, 2020 to 2024, Table DP03.
Population growth has been slow but positive over the past several decades: approximately 11.7 percent in the 1990s, 1.7 percent in the 2000s, and 2.1 percent in the 2010s. Marion County has not seen the explosive exurban growth of closer-in Chattanooga-area counties like Bradley or Hamilton, but its I-24 access and comparatively low cost of living have supported modest in-migration.
Agriculture

Marion County was never a plantation district. The topography (valley, plateau, and river bottoms) favored smallholder family farms, and that pattern has persisted. Row-crop agriculture has historically concentrated in the Sequatchie Valley and the river bottoms, while plateau farms tended toward subsistence homesteads, timber, and livestock grazing. Nineteenth-century accounts of the Sequatchie Valley described an exceptionally fertile corn-producing district, with the grain largely fed to cattle, horses, mules, and hogs rather than sold as a cash crop.
2022 Census of Agriculture
The 2022 Census of Agriculture, published by the U.S. Department of Agriculture's National Agricultural Statistics Service, counted 308 farms in Marion County on 62,071 acres of land, with an average farm size of 202 acres. Total market value of agricultural products sold was $43.1 million, up 153 percent from 2017. Livestock, poultry, and products accounted for 63 percent of the dollar sales, driven primarily by broilers and other meat-type chickens; crops made up the remaining 37 percent, led by soybeans, hay and forage, and corn for grain. Poultry and eggs alone ($24.97 million) accounted for 58 percent of all agricultural sales, and Marion ranks 16th of 95 Tennessee counties in poultry receipts. See the poultry and agriculture subpages for full detail.
| 2022 Census of Agriculture | Value |
|---|---|
| Number of farms | 308 |
| Land in farms (acres) | 62,071 |
| Average farm size (acres) | 202 |
| Market value of products sold | $43,097,000 |
| Net cash farm income | $7,868,000 |
| Average per-farm market value | $139,926 |
| Cropland (acres) | 28,925 |
| Pastureland (acres) | 9,404 |
| Woodland (acres) | 21,877 |
| Broilers and other meat-type chickens (inventory) | 918,298 |
| Cattle and calves (inventory) | 6,633 |
| Soybeans for beans (acres) | 8,755 |
| Forage, all types (acres) | 7,245 |
| Corn for grain (acres) | 6,386 |
Source: U.S. Department of Agriculture, National Agricultural Statistics Service, 2022 Census of Agriculture: Marion County, Tennessee.
Tennessee Century Farms
The Tennessee Century Farms Program recognizes family farms that have been continuously owned and operated by the same family for at least 100 years and that still include at least ten acres of the original farm in production. The program was created in 1975 and 1976 by the Tennessee Department of Agriculture as a bicentennial project and is now administered by the Center for Historic Preservation at Middle Tennessee State University. Statewide, roughly 2,300 farms have been certified. The program maintains a Marion County page on its official website; the public-facing map does not show specific farm locations in order to protect owners' privacy.
Personal Income and GDP
The U.S. Bureau of Economic Analysis publishes annual county-level estimates of total personal income, per capita personal income, and real gross domestic product. Marion County's per capita personal income rose from $47,540 in 2021 to $49,519 in 2022 to $51,590 in 2023, an increase of 8.5 percent over two years. Within Tennessee, Marion ranked 28th out of 95 counties on per capita personal income in 2023. The county's real gross domestic product (chained 2017 dollars) grew from $796 million in 2020 to $871 million in 2023, with Marion ranking 51st of 95 Tennessee counties on real GDP.
| Year | Per capita personal income | Real GDP (thousands, chained 2017 $) |
|---|---|---|
| 2020 | $796,230 | |
| 2021 | $47,540 | $826,098 |
| 2022 | $49,519 | $858,691 |
| 2023 | $51,590 | $871,426 |
Source: U.S. Bureau of Economic Analysis, Local Area Personal Income (LAPI news release, November 2024) and Real Gross Domestic Product by County (GDP by County news release, December 2024).
Appalachian Regional Commission Status
The Appalachian Regional Commission classifies each county in its 423-county region annually into one of five economic status tiers: Distressed, At-Risk, Transitional, Competitive, and Attainment. The rating is based on three economic indicators: the three-year average unemployment rate, per capita market income, and the poverty rate, each compared to U.S. averages. Marion County is classified as Transitional for fiscal year 2026, the middle tier. Within the county, two census tracts (502.01 and 503.02) are rated Distressed, up from one Distressed tract (502.01) in fiscal year 2025.
- FY 2026 county status: Transitional
- FY 2026 distressed tracts: 2 (502.01, 503.02)
- FY 2025 distressed tracts: 1 (502.01)
Source: Appalachian Regional Commission, County Economic Status and Distressed Areas in Appalachian Tennessee, Fiscal Year 2026; corresponding FY 2025 methodology documentation.
Elections
Tennessee does not register voters by party affiliation. In recent presidential elections, Marion County has voted decisively for Republican candidates, with the Republican share growing from 70.9 percent in 2016 to 77.4 percent in 2024. Turnout was 13,933 votes in 2024, 13,256 in 2020, and 10,862 in 2016. The Democratic vote share fell from 26.1 percent in 2016 to 21.7 percent in 2024, while third-party and independent candidates saw their combined share decline from 3.1 percent to 0.9 percent over the same period.
| Year | Republican | % | Democrat | % | Others | % | Total votes |
|---|---|---|---|---|---|---|---|
| 2016 | 7,696 | 70.85% | 2,832 | 26.07% | 334 | 3.08% | 10,862 |
| 2020 | 9,911 | 74.77% | 3,177 | 23.97% | 168 | 1.26% | 13,256 |
| 2024 | 10,788 | 77.43% | 3,026 | 21.72% | 119 | 0.85% | 13,933 |
Source: Tennessee Secretary of State, certified county-by-county returns, compiled at 2016, 2020, and 2024 Tennessee presidential-election articles on Wikipedia.
Civic and Government
Marion County operates under the standard Tennessee county government structure: an elected county mayor (the chief executive), an elected county commission (the legislative body), and separately elected constitutional officers for the sheriff's office, trustee, register, county clerk, and assessor of property. The commission has fifteen members elected from five districts. For the full history of county governance, including the county judge era and the 1978 reform, see the elections and county commission page.
County formation and county seat
Marion County was established in 1817 from former Cherokee land ceded under the 1817 Treaty at the Cherokee Agency, and was named for Revolutionary War general Francis Marion of South Carolina. The first county court met in 1817 at the home of John Shropshire in what was then called Cheekville, now Whitwell. In 1819 the county seat was moved to Jasper.
Elizabeth "Betsy" Pack, a Cherokee woman and daughter of Cherokee chief John Lowrey and Nannie Watts, sold the county commissioners 40 acres of her 640-acre treaty reservation for the seat of government. The first courthouse was built on this tract in 1820. Betsy Pack also operated a ferry on the Tennessee River, and Jasper's main north-south street is named Betsy Pack Drive in her honor.
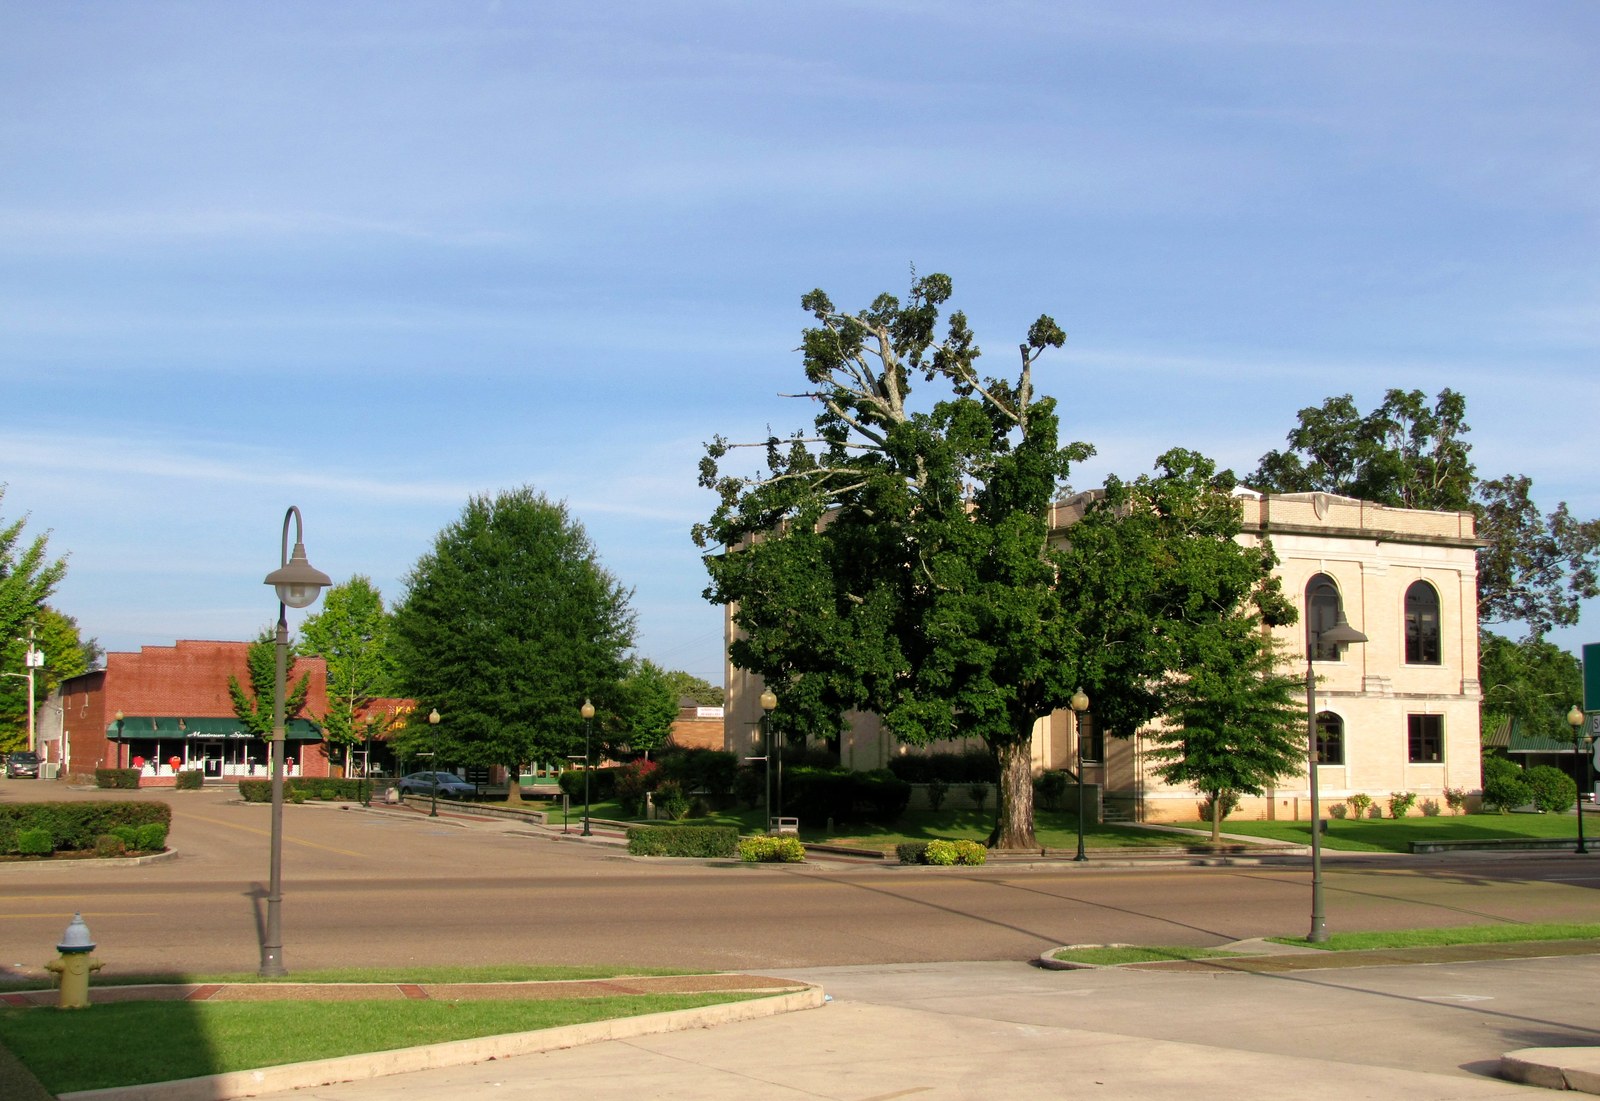
The courthouse
Three courthouses have stood in Jasper since the county seat arrived. The first, built in 1824 by John Mathas, was replaced in 1880 by a courthouse built by John Jones. The 1880 courthouse was destroyed by fire in 1922, and the present buff-colored brick courthouse was completed in 1925. It is a two-story building with two-story Doric pilasters, a full entablature at the roofline, arched windows, and an arched main entrance pavilion, with the Circuit Court courtroom on the second floor. The courthouse suffered additional fire damage in 1984 and was remodeled in 1986. See the courthouse page for the full history, including the Betsy Pack land sale and the war memorials on the grounds.
Richard City Special School District
One of Marion County's unusual civic features is the Richard City Special School District, an independent public school district that operates outside the countywide Marion County Schools system. It has its own elected board and funding, and its single school, Richard Hardy Memorial School, serves PreK through 12 at the southern edge of South Pittsburg. The district persisted even after South Pittsburg annexed the surrounding Richard City community in 1985.
Cities and Towns
- Jasper (county seat): population 3,612 (2020); founded 1819; on the Sequatchie Valley Scenic Byway
- South Pittsburg: population 3,106 (2020); incorporated 1887; home of Lodge Cast Iron and the National Cornbread Festival
- Whitwell: population 1,641 (2020); first county court site in 1817; home of the Paper Clips Project at Whitwell Middle School
- Kimball: population 1,545 (2020); the county's retail and service hub at the I-24 / US-72 interchange
- Monteagle: population 1,393 (2020); shared with Grundy and Franklin counties; site of the Monteagle Mountain I-24 grade
- Powells Crossroads: incorporated town on the upper Sequatchie Valley
- New Hope: incorporated city near the Tennessee River
- Orme: incorporated town, former coal-mining community on the Cumberland escarpment
Several once-incorporated or named places have since been absorbed or depopulated, including Richard City (now part of South Pittsburg), Victoria, Inman, and the original river town of Nickajack. The Communities directory has fuller writeups for each.
In Summary
Marion County is a small, rural, slowly growing county whose economy, land use, and government all trace back to the same valley-and-plateau geography that shaped its earliest settlement. A countywide government seated in Jasper, a single independent special school district at South Pittsburg, a manufacturing-and-services economy along the I-24 corridor, and a smallholder family-farm tradition in the valley are the four threads that most consistently describe the county as a civic and economic unit. At just under 29,000 residents, Marion County sits between its industrial-era peak and the slow, steady exurban growth that its I-24 connection to Chattanooga continues to sustain.
Related
The modern era (the post-industrial transition) →
Sources
- U.S. Census Bureau, American Community Survey 5-year estimates, 2020 to 2024, Table DP02 (households, education, veterans, disability, language, computer and internet use)
- U.S. Census Bureau, ACS 2020 to 2024, Table DP03 (employment, industry, occupation, commute, income, poverty, health insurance)
- U.S. Census Bureau, ACS 2020 to 2024, Table DP04 (housing occupancy, tenure, value, rent, costs)
- U.S. Census Bureau, ACS 2020 to 2024, Table DP05 (age, sex, race, ethnicity)
- U.S. Census Bureau, 2020 Decennial Census (total population and racial composition); county-level figures compiled in Marion County, Tennessee (Wikipedia) from the P1 and P2 redistricting files
- U.S. Bureau of Labor Statistics, Local Area Unemployment Statistics: Marion County, TN unemployment rate, annual averages 2019 to 2024
- BLS LAUS: Marion County, TN employment level
- BLS LAUS: Marion County, TN civilian labor force
- U.S. Bureau of Economic Analysis, Local Area Personal Income, November 2024 news release (county-level per capita personal income through 2023)
- BEA, Gross Domestic Product by County, December 2024 news release (county-level real GDP through 2023)
- USDA National Agricultural Statistics Service, 2022 Census of Agriculture: Marion County, Tennessee County Profile
- Appalachian Regional Commission, County Economic Status and Distressed Areas in Appalachian Tennessee, Fiscal Year 2026
- ARC: Classifying Economic Distress in Appalachian Counties (methodology)
- County Health Rankings and Roadmaps: Tennessee (health outcomes and factors)
- 2016 United States presidential election in Tennessee (Wikipedia; county-by-county returns from the Tennessee Secretary of State)
- 2020 United States presidential election in Tennessee (Wikipedia; county-by-county returns from the Tennessee Secretary of State)
- 2024 United States presidential election in Tennessee (Wikipedia; county-by-county returns from the Tennessee Secretary of State)
- Tennessee Encyclopedia: Marion County
- Tennessee Encyclopedia: Slavery (East Tennessee enslaved population context)
- Marion County, Tennessee (Wikipedia; historical population series compiled from decennial census publications)
- McReynolds High School (Wikipedia)
- South Pittsburg, Tennessee (Wikipedia; 2020 racial breakdown for the city)
- Historic South Pittsburg: McReynolds High School
- Tennessee Department of Economic and Community Development: Lodge Manufacturing expansion announcement, October 22, 2021
- Tennessee Secretary of State, Tennessee State Library and Archives: Marion County genealogical fact sheet
- MTSU Center for Historic Preservation: Tennessee Century Farms Program
- Marion County, Tennessee county government